Waldo RSI Overlay :oWaldo RSI Overlay :o Indicator Guide
Welcome to the guide for the Waldo RSI Overlay :o indicator on TradingView. This tool enhances your trading analysis through RSI-based overlays for trend analysis, divergence detection, and breakout/breakdown signals when used with its companion indicator, Waldo RSI :o.
Key Features:
RSI Overlay:
• RSI Source: Choose from:
o ON RSI: Uses the RSI values directly to detect pivots, focusing on RSI highs and lows for trend analysis.
o ON HIGH, ON CLOSE, ON LOW, ON OPEN:
These options base pivot detection on price action at those specific points, offering an alternative market structure view.
• RSI Settings:
o Source: Default is (H+L)/2, but you can select any price for RSI calculation.
o Length: Default RSI length is 7, which you can adjust for sensitivity.
Trend Lines:
• Show Trend Lines: Toggle to display trend lines based on pivot points.
• Zigzag Length: Sets the sensitivity of pivot point detection.
• Confirm Length: Ensures the validity of pivot points (default is 3).
• Colors: Customize colors for Higher Highs (HH), Lower Highs (LH), Higher Lows (HL), and Lower Lows (LL).
• Transparency and Line Width: Control how trend lines and fills appear.
• Label Size: Adjust the size of labels identifying pivot points.
Divergences:
• Classic Divergences:
o Show Classic Div: Enable to highlight regular divergences where price and RSI move in opposite directions.
o Colors: Define colors for bullish and bearish divergence lines and labels.
o Transparency and Line Width: Adjust the visual impact of divergence signals.
• Hidden Divergences:
o Similar settings as classic, but these highlight divergences indicating trend continuation.
Breakout/Breakdown:
• Show Breakout/Breakdown: When activated, this feature signals when the price breaks through previous highs or lows. To activate these breakouts, you need the companion indicator Waldo RSI :o, select the SRC in the External section, and select the crossovers for each one.
This combination provides RSI confirmation for breakout/breakdown events.
Overbought/Oversold Zones:
• Show Overbought and Oversold Zones: Bars are colored when RSI exceeds 70 (purple) or falls below 30 (blue), indicating potential market extremes.
Moving Averages (Optional):
• Show Moving Averages: Option to overlay two moving averages for trend confirmation.
• Source, Type, Length: Customize each MA's configuration.
Ghost Lines (Optional):
• Ghost Lines: When enabled, trend lines extend for only a specified period (Ghost Length) instead of indefinitely.
How to Use the Indicator:
1. Setup:
o Configure RSI settings by choosing the RSI Source and adjusting the RSI Length to suit your trading style.
o Set the Zigzag Length and Confirm Length for trend line sensitivity based on market volatility.
2. Trend Analysis:
o Look at the colored horizontal lines and fills for HH, LH, HL, LL to discern market structure and potential reversal points.
3. Divergence Detection:
o Identify divergences where price and RSI diverge. Regular divergences might signal trend exhaustion, while hidden ones could indicate trend persistence.
4. Breakout/Breakdown Signals:
o Ensure you have both the Waldo RSI Overlay :o and Waldo RSI :o indicators applied. Green triangles below bars signal breakouts; red ones above indicate breakdowns, based on price movement with RSI confirmation from the companion indicator.
5. Overbought/Oversold:
o Use these colored zones to spot potential momentum shifts or reversal areas.
6. Moving Averages on RSI:
o If used, these can help confirm trends or identify crossover signals for additional trade confirmation.
7. Ghost Lines:
o For a less cluttered chart, enable this to limit how far trend lines extend.
Tips for Usage:
• Always combine this indicator with other analytical tools for better confirmation. No single indicator should guide all decisions.
• Adjust settings according to the asset's behavior and your trading timeframe.
• Regularly review your settings as market dynamics change.
Remember, trading involves risk, and past performance doesn't predict future outcomes. Use this indicator within a comprehensive trading strategy.
Wyszukaj w skryptach "moving averages"

Arrow-SimplyTrade vol1.5-FinalTitle: Arrow-SimplyTrade vol1.5-Final
Description:
This advanced trading indicator is designed to assist traders in analyzing market trends and identifying optimal entry signals. It combines several popular technical analysis tools and strategies, including EMA (Exponential Moving Average), MA (Simple Moving Averages), Bollinger Bands, and candlestick patterns. This indicator provides both trend-following and counter-trend signals, making it suitable for various trading styles, such as scalping and swing trading.
Main Features:
EMA (Exponential Moving Average):
EMA200 is the main trend line that helps determine the overall market direction. When the price is above EMA200, the trend is considered bullish, and when the price is below EMA200, the trend is considered bearish.
It helps filter out signals that go against the prevailing market trend.
Simple Moving Averages (MA5 and MA15):
This indicator uses two Simple Moving Averages: MA5 (Fast) and MA15 (Slow). Their crossovers create buy or sell signals:
Buy Signal: When MA5 crosses above MA15, signaling a potential upward trend.
Sell Signal: When MA5 crosses below MA15, signaling a potential downward trend.
Bollinger Bands:
Bollinger Bands measure market volatility and can identify periods of overbought or oversold conditions. The Upper and Lower Bands help detect potential breakout points, while the Middle Line (Basis) serves as dynamic support or resistance.
This tool is particularly useful for identifying volatile conditions and potential reversals.
Arrows:
The indicator plots arrows on the chart to signal entry opportunities:
Green Arrows signal buy opportunities (when MA5 crosses above MA15 and price is above EMA200).
Red Arrows signal sell opportunities (when MA5 crosses below MA15 and price is below EMA200).
Opposite Arrows: Optionally, the indicator can also display arrows for counter-trend signals, triggered by MA5 and MA15 crossovers, regardless of the price's position relative to EMA200.
Candlestick Patterns:
The indicator detects popular candlestick patterns such as Bullish Engulfing, Bearish Engulfing, Hammer, and Doji.
These patterns are important for confirming entry points or anticipating trend reversals.
How to Use:
EMA200: The main trend line. If the price is above EMA200, consider long positions. If the price is below EMA200, consider short positions.
MA5 and MA15: Short-term trend indicators. The crossover of these averages generates buy or sell signals.
Bollinger Bands: Use these bands to spot overbought/oversold conditions. Breakouts from the bands may signal potential entry points.
Arrows: Green arrows represent buy signals, and red arrows represent sell signals. Opposite direction arrows can be used for counter-trend strategies.
Candlestick Patterns: Patterns like Bullish Engulfing or Doji can help confirm the signals.
Customizable Settings:
Fully customizable colors, line styles, and display settings for EMA, MAs, Bollinger Bands, and arrows.
The Candlestick Patterns feature can be toggled on or off based on user preference.
Important Notes:
This indicator is intended to be used in conjunction with other analysis tools.
Past performance does not guarantee future results.
Polish:
Tytuł: Arrow-SimplyTrade vol1.5-Final
Opis:
Ten zaawansowany wskaźnik handlowy jest zaprojektowany, aby pomóc traderom w analizie trendów rynkowych oraz identyfikowaniu optymalnych sygnałów wejścia. Łączy w sobie kilka popularnych narzędzi analizy technicznej i strategii, w tym EMA (Wykładnicza Średnia Ruchoma), MA (Prosta Średnia Ruchoma), Bollinger Bands oraz formacje świecowe. Wskaźnik generuje zarówno sygnały podążające za trendem, jak i przeciwnym trendowi, co sprawia, że jest odpowiedni do różnych stylów handlu, takich jak scalping oraz swing trading.
Główne Funkcje:
EMA (Wykładnicza Średnia Ruchoma):
EMA200 to główna linia trendu, która pomaga określić ogólny kierunek rynku. Gdy cena znajduje się powyżej EMA200, trend jest uznawany za wzrostowy, a gdy poniżej EMA200, za spadkowy.
Pomaga to filtrować sygnały, które są niezgodne z głównym trendem rynkowym.
Proste Średnie Ruchome (MA5 i MA15):
Wskaźnik używa dwóch Prostych Średnich Ruchomych: MA5 (szybka) oraz MA15 (wolna). Ich przecięcia generują sygnały kupna lub sprzedaży:
Sygnał Kupna: Kiedy MA5 przecina MA15 od dołu, sygnalizując potencjalny wzrost.
Sygnał Sprzedaży: Kiedy MA5 przecina MA15 od góry, sygnalizując potencjalny spadek.
Bollinger Bands:
Bollinger Bands mierzą zmienność rynku i mogą pomóc w identyfikowaniu okresów wykupienia lub wyprzedania rynku. Górna i dolna linia pomagają wykrywać punkty wybicia, a Środkowa Linia (Basis) działa jako dynamiczny poziom wsparcia lub oporu.
Narzędzie to jest szczególnie przydatne w wykrywaniu warunków zmienności i potencjalnych odwróceń trendu.
Strzałki:
Wskaźnik wyświetla strzałki na wykresie, które wskazują sygnały kupna i sprzedaży:
Zielona strzałka wskazuje sygnał kupna (gdy MA5 przecina MA15 i cena jest powyżej EMA200).
Czerwona strzałka wskazuje sygnał sprzedaży (gdy MA5 przecina MA15 i cena jest poniżej EMA200).
Strzałki w przeciwnym kierunku: Opcjonalna funkcja, która pokazuje strzałki w przeciwnym kierunku, uruchamiane przez przecięcia MA5 i MA15, niezależnie od pozycji ceny względem EMA200.
Formacje Świecowe:
Wskaźnik wykrywa popularne formacje świecowe, takie jak Bullish Engulfing, Bearish Engulfing, Hammer oraz Doji.
Formacje te pomagają traderom potwierdzić punkty wejścia i przewidzieć możliwe odwrócenia trendu.
Jak Używać:
EMA200: Główna linia trendu. Jeśli cena jest powyżej EMA200, rozważaj pozycje długie. Jeśli cena jest poniżej EMA200, rozważaj pozycje krótkie.
MA5 i MA15: Śledzą krótkoterminowe zmiany trendu. Przecięcia tych średnich generują sygnały kupna lub sprzedaży.
Bollinger Bands: Używaj tych pasm do wykrywania wykupionych lub wyprzedanych warunków. Wybicia z pasm mogą wskazywać potencjalne punkty wejścia.
Strzałki: Zielona strzałka wskazuje sygnał kupna, a czerwona strzałka sygnał sprzedaży. Strzałki w przeciwnym kierunku mogą być używane do strategii przeciwtrendowych.
Formacje Świecowe: Formacje takie jak Bullish Engulfing czy Doji mogą pomóc w potwierdzaniu sygnałów.
Ustawienia Personalizacji:
W pełni personalizowalne kolory, style linii i ustawienia wyświetlania dla EMA, MAs, Bollinger Bands oraz strzałek.
Funkcja Formacji Świecowych może być włączana lub wyłączana według preferencji użytkownika.
Ważne Uwagi:
Ten wskaźnik powinien być używany w połączeniu z innymi narzędziami analizy rynku.
Wyniki z przeszłości nie gwarantują wyników w przyszłości.

Golden & Death Cross with Re-Activation [By Oberlunar]🎄 Merry Christmas to All Traders! 🎄
Let me introduce you to a practical and customizable classic tool: the Golden & Death Cross with Re-Activation. This script is designed to help you navigate the markets with precision and adaptability.
Why Is This Script Important?
1. Customizable Moving Averages
You can choose from SMA, EMA, WMA, HMA, or RMA for both moving averages. This flexibility allows you to tailor the strategy to fit different markets and trading styles.
2. Smart Signal Handling
The script generates Golden Cross (LONG) and Death Cross (SHORT) signals while deactivating them automatically when the moving averages start to converge, avoiding unnecessary noise.
3. Reactivation Based on Distance Threshold
With the treshold parameter, signals are reactivated only when the moving averages move apart sufficiently, ensuring that the signals remain meaningful and not just random market noise.
What Are These Moving Averages?
SMA (Simple Moving Average),
EMA (Exponential Moving Average),
WMA (Weighted Moving Average),
HMA (Hull Moving Average),
RMA (Relative Moving Average)
Community Input
We invite you to test this script on various markets (forex, stocks, crypto) and share your insights:
Which moving average combination works best for EUR/USD?
How about BTC/USD?
Does the treshold make a noticeable difference?
Let us know in the comments!
Example Settings
MA 1 Type: HMA, Length: 21
MA 2 Type: HMA, Length: 200
Reactivation Threshold: 0.5
Experiment with it, and let us know your findings.
Wishing you a calm holiday season and a profitable new year ahead! 🎁
🎄 Merry Christmas and Happy Trading! 🎄

Heiken Ashi MTF Monitor - Better Formula - EMA, AMA, KAFA, T3Heiken Ashi MTF Monitor - Better Formula - EMA, AMA, KAFA, T3
This indicator is based on the works of Loxx & Smart_Money-Trader, without their initial codes, none of this will be possible.
This Pine Script indicator provides a multi-timeframe (MTF) analysis of Heiken Ashi trends, designed to enhance the traditional Heiken Ashi method with advanced smoothing techniques such as the Exponential Moving Average (EMA), Adaptive Moving Average (AMA), Kaufman’s Adaptive Moving Average (KAMA), and the Triple Exponential Moving Average (T3). The indicator offers a flexible approach to identify bullish, bearish, and neutral trends across six customizable timeframes and various Heiken Ashi calculation methods.
Key Features:
Multi-Timeframe (MTF) Support: The indicator allows you to monitor trends across six timeframes (e.g., 2-hour, 4-hour, daily, weekly, monthly), giving a holistic view of market conditions at different scales.
Heiken Ashi Calculation Methods: Choose between traditional Heiken Ashi or an enhanced "Better HA" method for more refined trend analysis.
Smoothing Options: Apply different smoothing techniques, including EMA, T3, KAMA, or AMA, to the Heiken Ashi values for smoother, more reliable trend signals.
Non-Repaint Option: This feature ensures that the values do not repaint after the bar closes, providing a more reliable historical view.
Customizable Plotting: The indicator offers full customization of which timeframes to display and whether to show labels for each timeframe.
Inputs and Settings:
Timeframe Inputs:
Users can set up to six different timeframes, ranging from intraday (2-hour, 4-hour) to higher timeframes (daily, weekly, monthly).
Timeframes can be enabled or disabled individually for each analysis.
Label Visibility:
Labels indicating the trend direction (bullish, bearish, neutral) can be shown for each timeframe. This helps with clarity when monitoring multiple timeframes simultaneously.
Smoothing Options:
EMA: Exponential Moving Average for standard smoothing.
AMA: Adaptive Moving Average, which adapts its smoothing based on market volatility.
KAMA: Kaufman’s Adaptive Moving Average, which adjusts its sensitivity to price fluctuations.
T3: Triple Exponential Moving Average, providing a smoother and more responsive moving average.
None: No smoothing applied (for raw Heiken Ashi calculations).
Non-Repaint Setting:
Enabling this ensures the trend values do not change after the bar closes, offering a stable historical view of trends.
Core Functions:
Heiken Ashi Calculations:
Traditional HA: The classic Heiken Ashi calculation is used here, where each bar's open, close, high, and low are computed based on the average price of the previous bar.
Better HA: A refined calculation method, where the raw Heiken Ashi close is adjusted by considering the price range. This smoother value is then optionally processed through a moving average function for further smoothing.
Heiken Ashi Trend Calculation:
Based on the selected Heiken Ashi method (Traditional or Better HA), the indicator checks whether the trend is bullish (upward movement), bearish (downward movement), or neutral (sideways movement).
For the "Better HA" method, the trend determination uses the difference between the smoothed Heiken Ashi close and open.
Moving Averages:
The moving averages applied to the Heiken Ashi values are configurable:
EMA: Standard smoothing with an exponential weighting.
T3: A triple exponential smoothing technique that provides a smoother moving average.
KAMA: An adaptive smoothing technique that adjusts to market noise.
AMA: An adaptive moving average that reacts to market volatility, making it more flexible.
None: For raw, unsmoothed Heiken Ashi data.
Trend Detection:
The indicator evaluates the direction of the trend for each timeframe and assigns a color-coded value (bearish, bullish, or neutral).
The trend values are plotted as circles, and their color reflects the detected trend: red for bearish, green for bullish, and white for neutral.
Multi-Timeframe (MTF) Support:
The indicator can be used to analyze up to six different timeframes simultaneously.
The trend for each timeframe is calculated and displayed as circles on the chart.
Users can enable or disable individual timeframes, allowing for a customizable view based on which timeframes they are interested in monitoring.
Plotting:
The indicator plots circles at specific levels based on the detected trend (Level 1 for the 2-hour timeframe, Level 2 for the 4-hour timeframe, etc.). The size and color of these circles represent the trend direction.
These plotted values provide a quick visual reference for trend direction across multiple timeframes.
Usage:
Trend Confirmation: By monitoring trends across multiple timeframes, traders can use this indicator to confirm trends and avoid false signals.
Customizable Timeframe Analysis: Traders can focus on shorter timeframes for intraday trades or look at longer timeframes for a broader market perspective.
Smoothing for Clarity: By applying various moving average techniques, traders can reduce noise and get a clearer view of the trend.
Non-Repainting: The non-repaint option ensures the indicator values remain consistent even after the bar closes, providing more reliable signals for backtesting or live trading.
This Heiken Ashi MTF Monitor indicator with better formulas and smoothing options is designed for traders who want to analyze trends across multiple timeframes while benefiting from advanced moving averages and more refined Heiken Ashi calculations. The customizable settings for smoothing, timeframe selection, and label visibility allow users to tailor the indicator to their specific needs and trading style.

Fibonacci Moving Average PlusFibonacci Moving Average Plus is a sophisticated technical indicator that employs the first 15 numbers of the Fibonacci sequence to create dynamic moving average channels. This indicator aims to capture both immediate and long-term price movements by calculating Exponential Moving Averages (EMAs) based on these Fibonacci values. By using Fibonacci-based moving averages for both high and low price points, the indicator generates a visual channel that reflects the ebb and flow of market trends, acting as potential zones of support and resistance. Additionally, the indicator provides midline, retracement, and extension levels rooted in Fibonacci ratios, which are frequently observed as key levels for reversals or trend continuation.
Ideology Behind Using Fibonacci Sequence-Based Moving Averages
The Fibonacci sequence, known for its mathematical harmony and prevalence in natural patterns, is widely utilized in technical analysis to identify potential turning points in markets. In this indicator, the first 15 Fibonacci numbers (5, 8, 13, 21, etc.) are used as the lookback periods for EMAs to capture different layers of market sentiment. These moving averages represent timeframes that are theoretically in alignment with the natural rhythms of market cycles, where key levels—often coinciding with Fibonacci numbers—can act as magnetic points for price.
The Fibonacci high and low channels aim to encapsulate price action, giving traders a sense of whether the market is trending, consolidating, or experiencing reversal pressure. These levels, grounded in both mathematics and market psychology, help traders spot areas where price might face resistance or find support.
Key Features
Fibonacci Moving Average High and Low: This indicator calculates the high and low EMAs based on Fibonacci sequence numbers (e.g., 5, 8, 13, etc.) for enhanced trend analysis.
Golden Pocket Retracement (GPR) and Extension (GPE) Bands: Displays common Fibonacci retracement and extension levels (0.618, 0.65 for retracement, and 1.618, 1.65 for extension).
Midline: Plots the average of the Fibonacci high and low to act as an additional reference level.
Stop-Loss Levels: Provides suggested stop-loss levels based on Fibonacci levels for both long and short positions.
Basic User Guide
Adjust Input Settings:
Input Timeframe: Set a specific timeframe for the Fibonacci moving average calculation, separate from the chart's primary timeframe.
Show Fibonacci MA High/Low: Toggle the visibility of the high and low Fibonacci moving averages.
Show Mid Line: Display a midline for added trend reference.
Show Golden Pocket Bands: Choose to display retracement or extension bands for potential support or resistance zones.
Show Stop-Loss Levels: Enable to visualize potential stop-loss levels for both long and short trades.
Interpretation:
Fibonacci MA High and Low: Use these lines to gauge the general trend. When the price is above both, it may indicate an uptrend; below both, a downtrend.
Golden Pocket Retracement: This zone (between 0.618 and 0.65) is often a key level for potential reversals or support/resistance.
Golden Pocket Extension: The 1.618 and 1.65 levels can indicate potential profit-taking or trend exhaustion points.
Stop-Loss Levels: The calculated stop-loss levels (long SL below and short SL above) can aid in risk management.
Customization:
You can customize the appearance and visibility of each component through the input settings to fit your specific strategy and visual preferences.
This indicator should be used alongside other technical analysis tools to provide a more comprehensive trading approach.
This Indicator would not exist without the original contributions and blessing from Sofien Kaabar

PDF Smoothed Moving Average [BackQuant]PDF Smoothed Moving Average
Introducing BackQuant’s PDF Smoothed Moving Average (PDF-MA) — an innovative trading indicator that applies Probability Density Function (PDF) weighting to moving averages, creating a unique, trend-following tool that offers adaptive smoothing to price movements. This advanced indicator gives traders an edge by blending PDF-weighted values with conventional moving averages, helping to capture trend shifts with enhanced clarity.
Core Concept: Probability Density Function (PDF) Smoothing
The Probability Density Function (PDF) provides a mathematical approach to applying adaptive weighting to data points based on a specified variance and mean. In the PDF-MA indicator, the PDF function is used to weight price data, adding a layer of probabilistic smoothing that enhances the detection of trend strength while reducing noise.
The PDF weights are controlled by two key parameters:
Variance: Determines the spread of the weights, where higher values spread out the weighting effect, providing broader smoothing.
Mean : Centers the weights around a particular price value, influencing the trend’s directionality and sensitivity.
These PDF weights are applied to each price point over the chosen period, creating an adaptive and smooth moving average that more closely reflects the underlying price trend.
Blending PDF with Standard Moving Averages
To further improve the PDF-MA, this indicator combines the PDF-weighted average with a traditional moving average, selected by the user as either an Exponential Moving Average (EMA) or Simple Moving Average (SMA). This blended approach leverages the strengths of each method: the responsiveness of PDF smoothing and the robustness of conventional moving averages.
Smoothing Method: Traders can choose between EMA and SMA for the additional moving average layer. The EMA is more responsive to recent prices, while the SMA provides a consistent average across the selected period.
Smoothing Period: Controls the length of the lookback period, affecting how sensitive the average is to price changes.
The result is a PDF-MA that provides a reliable trend line, reflecting both the PDF weighting and traditional moving average values, ideal for use in trend-following and momentum-based strategies.
Trend Detection and Candle Coloring
The PDF-MA includes a built-in trend detection feature that dynamically colors candles based on the direction of the smoothed moving average:
Uptrend: When the PDF-MA value is increasing, the trend is considered bullish, and candles are colored green, indicating potential buying conditions.
Downtrend: When the PDF-MA value is decreasing, the trend is considered bearish, and candles are colored red, signaling potential selling or shorting conditions.
These color-coded candles provide a quick visual reference for the trend direction, helping traders make real-time decisions based on the current market trend.
Customization and Visualization Options
This indicator offers a range of customization options, allowing traders to tailor it to their specific preferences and trading environment:
Price Source : Choose the price data for calculation, with options like close, open, high, low, or HLC3.
Variance and Mean : Fine-tune the PDF weighting parameters to control the indicator’s sensitivity and responsiveness to price data.
Smoothing Method : Select either EMA or SMA to customize the conventional moving average layer used in conjunction with the PDF.
Smoothing Period : Set the lookback period for the moving average, with a longer period providing more stability and a shorter period offering greater sensitivity.
Candle Coloring : Enable or disable candle coloring based on trend direction, providing additional clarity in identifying bullish and bearish phases.
Trading Applications
The PDF Smoothed Moving Average can be applied across various trading strategies and timeframes:
Trend Following : By smoothing price data with PDF weighting, this indicator helps traders identify long-term trends while filtering out short-term noise.
Reversal Trading : The PDF-MA’s trend coloring feature can help pinpoint potential reversal points by showing shifts in the trend direction, allowing traders to enter or exit positions at optimal moments.
Swing Trading : The PDF-MA provides a clear trend line that swing traders can use to capture intermediate price moves, following the trend direction until it shifts.
Final Thoughts
The PDF Smoothed Moving Average is a highly adaptable indicator that combines probabilistic smoothing with traditional moving averages, providing a nuanced view of market trends. By integrating PDF-based weighting with the flexibility of EMA or SMA smoothing, this indicator offers traders an advanced tool for trend analysis that adapts to changing market conditions with reduced lag and increased accuracy.
Whether you’re trading trends, reversals, or swings, the PDF-MA offers valuable insights into the direction and strength of price movements, making it a versatile addition to any trading strategy.
RSI with Swing Trade by Kelvin_VAlgorithm Description: "RSI with Swing Trade by Kelvin_V"
1. Introduction:
This algorithm uses the RSI (Relative Strength Index) and optional Moving Averages (MA) to detect potential uptrends and downtrends in the market. The key feature of this script is that it visually changes the candle colors based on the market conditions, making it easier for users to identify potential trend swings or wave patterns.
The strategy offers flexibility by allowing users to enable or disable the MA condition. When the MA condition is enabled, the strategy will confirm trends using two moving averages. When disabled, the strategy will only use RSI to detect potential market swings.
2. Key Features of the Algorithm:
RSI (Relative Strength Index):
The RSI is used to identify potential market turning points based on overbought and oversold conditions.
When the RSI exceeds a predefined upper threshold (e.g., 60), it suggests a potential uptrend.
When the RSI drops below a lower threshold (e.g., 40), it suggests a potential downtrend.
Moving Averages (MA) - Optional:
Two Moving Averages (Short MA and Long MA) are used to confirm trends.
If the Short MA crosses above the Long MA, it indicates an uptrend.
If the Short MA crosses below the Long MA, it indicates a downtrend.
Users have the option to enable or disable this MA condition.
Visual Candle Coloring:
Green candles represent a potential uptrend, indicating a bullish move based on RSI (and MA if enabled).
Red candles represent a potential downtrend, indicating a bearish move based on RSI (and MA if enabled).
3. How the Algorithm Works:
RSI Levels:
The user can set RSI upper and lower bands to represent potential overbought and oversold levels. For example:
RSI > 60: Indicates a potential uptrend (bullish move).
RSI < 40: Indicates a potential downtrend (bearish move).
Optional MA Condition:
The algorithm also allows the user to apply the MA condition to further confirm the trend:
Short MA > Long MA: Confirms an uptrend, reinforcing a bullish signal.
Short MA < Long MA: Confirms a downtrend, reinforcing a bearish signal.
This condition can be disabled, allowing the user to focus solely on RSI signals if desired.
Swing Trade Logic:
Uptrend: If the RSI exceeds the upper threshold (e.g., 60) and (optionally) the Short MA is above the Long MA, the candles will turn green to signal a potential uptrend.
Downtrend: If the RSI falls below the lower threshold (e.g., 40) and (optionally) the Short MA is below the Long MA, the candles will turn red to signal a potential downtrend.
Visual Representation:
The candle colors change dynamically based on the RSI values and moving average conditions, making it easier for traders to visually identify potential trend swings or wave patterns without relying on complex chart analysis.
4. User Customization:
The algorithm provides multiple customization options:
RSI Length: Users can adjust the period for RSI calculation (default is 4).
RSI Upper Band (Potential Uptrend): Users can customize the upper RSI level (default is 60) to indicate a potential bullish move.
RSI Lower Band (Potential Downtrend): Users can customize the lower RSI level (default is 40) to indicate a potential bearish move.
MA Type: Users can choose between SMA (Simple Moving Average) and EMA (Exponential Moving Average) for moving average calculations.
Enable/Disable MA Condition: Users can toggle the MA condition on or off, depending on whether they want to add moving averages to the trend confirmation process.
5. Benefits of the Algorithm:
Easy Identification of Trends: By changing candle colors based on RSI and MA conditions, the algorithm makes it easy for users to visually detect potential trend reversals and trend swings.
Flexible Conditions: The user has full control over the RSI and MA settings, allowing them to adapt the strategy to different market conditions and timeframes.
Clear Visualization: With the candle color changes, users can quickly recognize when a potential uptrend or downtrend is forming, enabling faster decision-making in their trading.
6. Example Usage:
Day traders: Can apply this strategy on short timeframes such as 5 minutes or 15 minutes to detect quick trends or reversals.
Swing traders: Can use this strategy on longer timeframes like 1 hour or 4 hours to identify and follow larger market swings.

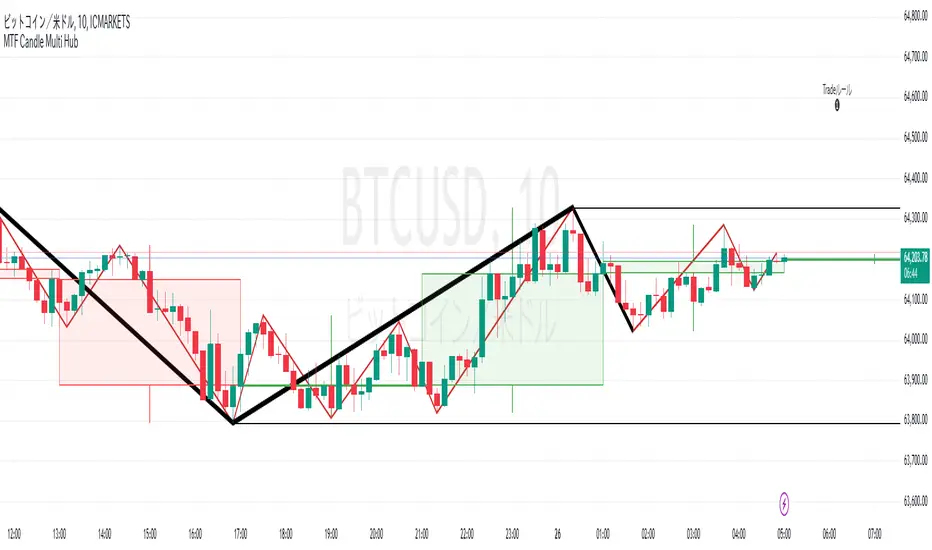
MTF Candle Multi HubMTF Candle Multi Hub Indicator - Guide 日本語解説は下記
Introduction
The "MTF Candle Multi Hub" indicator is a versatile and comprehensive tool designed to visualize multiple timeframes' candlestick data, Heikin Ashi candles, and moving averages on a single chart. This indicator also includes a Zigzag feature with the ability to draw horizontal lines at significant swing points, making it a powerful tool for technical analysis.
Key Features
Multi-Timeframe Candlestick Display:
The indicator allows you to display candlesticks from different timeframes, including 5-minute, 15-minute, 1-hour, 4-hour, daily, and weekly timeframes.
Each timeframe's candlestick can be toggled on or off using the settings panel.
Candlesticks are color-coded based on whether the close is higher or lower than the open, with customizable colors for bullish and bearish candles.
Heikin Ashi Candlesticks:
Heikin Ashi candlesticks are also available for 5-minute, 15-minute, 1-hour, 4-hour, daily, and weekly timeframes.
Like the standard candlesticks, these can be toggled on or off, and their colors are customizable.
Moving Averages (MA):
The indicator supports up to four different moving averages, which can be either Simple Moving Average (SMA) or Exponential Moving Average (EMA).
The user can toggle each moving average on or off and adjust the period and type from the settings panel.
An additional feature allows the space between two moving averages to be filled with a color, indicating the relative position of the MAs.
Zigzag Indicator with Horizontal Lines:
The Zigzag feature plots lines between significant swing highs and lows, helping identify trends and potential reversal points.
Two Zigzag lines can be configured, each with customizable swing length, line color, style, and width.
The indicator also offers the ability to draw horizontal lines at the start and end of each Zigzag swing. These horizontal lines can be customized in terms of color, style, width, and length.
The number of horizontal lines to be drawn can be set, allowing for focused analysis of the most recent swings.
Label and Comment Display:
The indicator provides the option to display custom labels and comments on the chart.
You can enter up to ten different comments, which will be displayed in a label at the last candlestick of the chart.
The label's position, background color, text color, and text size are fully customizable.
Trading Strategy
Trend Following with Multi-Timeframe Analysis:
Use the multi-timeframe candlestick and Heikin Ashi features to assess the trend across different timeframes. For example, if both the daily and 4-hour Heikin Ashi candles are bullish, it may indicate a strong uptrend.
Entry and Exit Signals:
Use the Zigzag indicator to identify potential entry points by looking for a new swing high or low.
Horizontal lines from the Zigzag can be used as support and resistance levels, helping to determine potential entry and exit points.
Moving Average Crossovers:
Monitor the crossovers of the moving averages. For example, when a shorter-term MA crosses above a longer-term MA, it may signal a potential buy opportunity.
Confluence of Signals:
The best trading opportunities may arise when multiple signals align. For example, a bullish Zigzag swing, supported by bullish Heikin Ashi candles and a moving average crossover, could provide a strong buy signal.
Disclaimer
For Educational Purposes Only: This indicator is provided for educational purposes and should not be used as the sole basis for any trading decisions.
No Guarantees: The indicator is provided "as is" without any guarantees of accuracy or completeness. Market conditions can change rapidly, and this indicator may not always reflect the most accurate market state.
Test Thoroughly: Bugs may exist in the script. It is highly recommended to test this script on a demo account before using it in live trading.
Use with Caution: Always use this indicator in conjunction with other analysis tools. Do not rely solely on this indicator for making trading decisions.
Sudden Changes or Removal: The indicator may be subject to sudden changes or removal without prior notice. The developer is not responsible for any issues this may cause.
By using this indicator, you agree to these terms.
MTF Candle Multi Hub インジケーター - ガイド
はじめに
「MTF Candle Multi Hub」インジケーターは、複数の時間枠のローソク足データ、平均足、移動平均線を1つのチャート上で視覚化するために設計された多用途かつ包括的なツールです。このインジケーターには、水平線を描画する機能を備えたジグザグ機能も含まれており、テクニカル分析において強力なツールとなります。
主な機能
マルチタイムフレームのローソク足表示:
5分足、15分足、1時間足、4時間足、日足、週足のローソク足を表示することができます。
各時間枠のローソク足は設定パネルでオンまたはオフに切り替えることができます。
ローソク足は、終値が始値より高いか低いかに基づいて色分けされており、強気と弱気のローソク足の色をカスタマイズできます。
平均足ローソク足:
5分足、15分足、1時間足、4時間足、日足、週足の平均足ローソク足を表示することができます。
標準のローソク足と同様に、これらをオンまたはオフに切り替え、色をカスタマイズすることが可能です。
移動平均線(MA):
このインジケーターは、単純移動平均線(SMA)または指数移動平均線(EMA)のいずれかを選択できる4つの移動平均線をサポートしています。
各移動平均線をオンまたはオフに切り替え、期間やタイプを設定パネルから調整できます。
また、2本の移動平均線の間に色を塗ることで、MAの相対的な位置を視覚的に表示する機能もあります。
ジグザグインジケーターと水平線:
ジグザグ機能は、重要なスイングの高値と安値の間に線を引き、トレンドや潜在的な反転ポイントを識別するのに役立ちます。
2本のジグザグラインを設定することができ、それぞれのスイングの長さ、線の色、スタイル、幅をカスタマイズできます。
また、ジグザグのスイングの始点と終点に水平線を描画する機能も提供されています。これらの水平線は、色、スタイル、幅、長さをカスタマイズできます。
描画する水平線の本数を設定でき、最新のスイングに焦点を当てた分析が可能です。
ラベルとコメントの表示:
インジケーターは、チャート上にカスタムラベルとコメントを表示するオプションを提供します。
最大10個の異なるコメントを入力することができ、これらはチャートの最新のローソク足にラベルとして表示されます。
ラベルの位置、背景色、テキストの色、テキストのサイズは完全にカスタマイズ可能です。
トレード戦略
マルチタイムフレーム分析を使用したトレンドフォロー:
マルチタイムフレームのローソク足や平均足の機能を使用して、異なる時間枠でのトレンドを評価します。例えば、日足と4時間足の平均足が共に強気であれば、強い上昇トレンドを示している可能性があります。
エントリーとエグジットシグナル:
ジグザグインジケーターを使用して、新たなスイング高値または安値を確認し、エントリーポイントを見極めます。
ジグザグの水平線をサポートおよびレジスタンスレベルとして使用し、エントリーやエグジットのタイミングを判断します。
移動平均線のクロスオーバー:
移動平均線のクロスオーバーを監視します。例えば、短期の移動平均線が長期の移動平均線を上抜けた場合、買いのシグナルとなる可能性があります。
シグナルのコンフルエンス:
複数のシグナルが一致する場合、最も良いトレード機会が生まれるかもしれません。例えば、強気のジグザグスイング、強気の平均足、移動平均線のクロスオーバーが揃うと、強力な買いシグナルとなる可能性があります。
免責事項
教育目的のみ: このインジケーターは教育目的で提供されており、トレードの決定を行う際の唯一の基準として使用すべきではありません。
保証なし: インジケーターは「現状のまま」提供されており、その正確性や完全性についての保証はありません。市場の状況は急速に変化する可能性があり、このインジケーターが常に最も正確な市場状況を反映するとは限りません。
十分なテストを: このスクリプトにはバグが存在する可能性があります。実際のトレードで使用する前に、デモ口座で十分にテストすることを強くお勧めします。
慎重に使用: このインジケーターを他の分析ツールと併用して使用してください。このインジケーターだけに頼ってトレードの決定を行うべきではありません。
突然の変更や削除の可能性: このインジケーターは予告なく変更や削除が行われる場合があります。そのため、利用者に不利益が生じる可能性がありますが、開発者はその責任を負いません。
このインジケーターを使用することで、これらの条件に同意したものとみなされます。
Raj - Mark Minervini Stage 2 with RSTitle: Mark Minervini Stage 2 Screener with Custom RS
Description:
This script is designed to identify stocks that meet the criteria for Mark Minervini's Stage 2 trend setup, incorporating custom relative strength (RS) ranking.
Key Features:
Moving Averages: Tracks the 50-day, 150-day, and 200-day Simple Moving Averages (SMA) to identify trend alignment.
Price Conditions: Ensures the stock price is above key moving averages, is within 25% of its 52-week high, and is at least 25% above its 52-week low.
Custom Relative Strength (RS): Compares the stock's performance against a benchmark (e.g., S&P 500) to ensure it has a strong relative strength. The RS is normalized on a 0-100 scale, and only stocks with an RS above 70 are highlighted.
Visual Indicators: The script plots moving averages on the chart and labels points where all conditions for the Stage 2 setup are met.
Usage:
Apply this script to your charts to find stocks that are in a strong uptrend and meet Mark Minervini's Stage 2 criteria.
Customize the benchmark symbol for the RS calculation to fit your market or preference
Bulls And Bears [CHE]This Pine Script™ indicator, Bulls And Bears , aims to provide traders with potential entry points by analyzing market conditions. Here's how it works:
Calculation of Maximum and Minimum Values: The script calculates the highest and lowest values based on the high, open, close, and low prices of the asset.
Relative Strength Index (RSI) Condition: It evaluates whether the RSI value (with a period of 14) is above 50, indicating bullish momentum.
Bullish and Bearish Conditions: Based on the calculated maximum and minimum values, along with the RSI condition, it determines bullish and bearish conditions. If the current maximum value is higher than the previous maximum and the RSI condition is met, it suggests a bullish condition. Conversely, if the current maximum value is lower than the previous maximum and the RSI condition is not met, it suggests a bearish condition.
Super Smoother Function: This function is used to calculate a smoother moving average, reducing noise in the data.
Input Parameters: Traders can adjust the "Length Difference" and "Length threshold" parameters to customize the indicator according to their trading preferences.
Calculation of Super Smooth Moving Averages: The script calculates super smooth moving averages for both bullish and bearish conditions.
Plotting: It plots the super smooth moving averages on the chart, indicating potential entry points for bullish (green) and bearish (red) conditions.
Filling Areas: It fills the areas between the moving averages and the threshold line based on the conditions. Green filling represents bullish conditions, while red filling represents bearish conditions.
By using this indicator, traders can potentially identify favorable entry points based on market conditions, helping them make informed trading decisions.

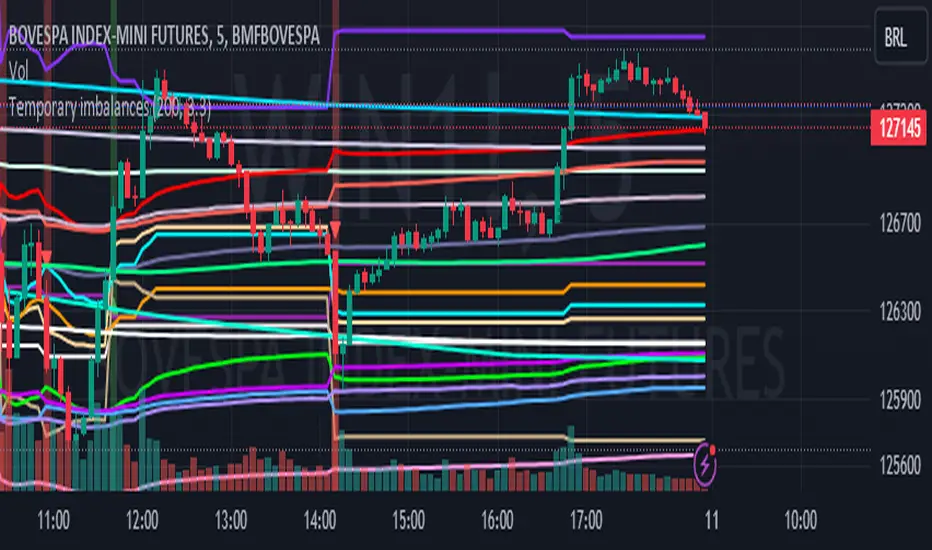
Temporary imbalances 2.0 This indicator attempts to calculate potential points of imbalance and equilibrium based on VWAPs and modified moving averages. The idea is to determine if there has been a change in volume and perform the calculation from that point It uses the standard deviation to determine the significant imbalance threshold. Candles with bullish imbalances are highlighted in green, while candles with bearish imbalances are highlighted in red.
"It also features a set of VWAPs and modified moving averages that you can enable or disable."
When you activate the 'Show Anchor VWAP' option, it will add five modified VWAPs.
Practical Significance:
The Anchored VWAP is a volume-weighted average price that serves as a dynamic reference to assess the average price during specific moments of market imbalance.
During a bullish imbalance, the anchor_vwap reflects the VWAP at that moment, emphasizing price behavior during that specific period.
Similarly, in a bearish imbalance, the anchor_vwap provides the associated VWAP for that condition, highlighting price movements during the imbalance phase.
How to Use:
The anchor_vwap can be employed to contextualize the volume-weighted average price during critical moments associated with significant changes in market imbalance.
By analyzing price behavior during and after periods of imbalance, the Anchored VWAP can help better understand market dynamics and identify potential areas of support or resistance.
Show VWAP Percent Imbalance"
Definition: Represents the Volume Weighted Average Price (VWAP) adjusted by the volume-weighted average of the price multiplied by volume, with a focus on conditions where the percentage volume variation surpasses a predefined threshold.
Calculation: Utilizes the simple moving average weighted of the product of the volume-weighted average price and volume only when the percentage volume variation exceeds a specific threshold.
Interpretation: Provides insight into the volume-weighted price trend during conditions where the percentage volume variation exceeds a predefined limit.
The "showDeltaVWAP" is a toggleable setting that you can turn on or off. When activated, it displays special lines on the chart. Let's understand what these lines represent:
Delta Anchor VWAP:
A green line (Delta Anchor VWAP) represents a measure of market volume imbalance.
Delta2 Anchor VWAP:
A red line (Delta2 Anchor VWAP) shows another perspective of volume imbalance.
VWAP Delta Volume:
A light blue line (VWAP Delta Volume) displays a volume-weighted average of price.
VWAP Delta Volume2:
An orange line (VWAP Delta Volume2) shows another view of the volume-weighted average of price.
Delta3 Anchor VWAP:
A light blue line (Delta3 Anchor VWAP) represents a combination of the previous measures.
Delta4 Anchor VWAP:
A purple line (Delta4 Anchor VWAP) is another combination, providing an overall view.
These lines are based on different conditions and calculations related to trading volume. When you activate "showDeltaVWAP," these lines appear on the chart, aiding in better understanding market behavior.
"Show Faster Volatility" is an option that you can enable or disable. When activated (set to true), it displays special lines on the chart called "Faster Volatility VWAP," "Faster Volatility VWAP2," and "Faster Volatility VWAP3." Let's understand what these lines represent:
Faster Volatility VWAP:
A purple line (Faster Volatility VWAP) is a Volume Weighted Average Price (VWAP) that is calculated more quickly based on short-term price reversal patterns.
Faster Volatility VWAP2:
A light gray line (Faster Volatility VWAP2) is another Volume Weighted Average Price (VWAP) that is calculated even more quickly based on even shorter-term price reversal patterns.
Faster Volatility VWAP3:
A purple line (Faster Volatility VWAP3) is another Volume Weighted Average Price (VWAP) calculated rapidly based on even shorter-term price reversal patterns.
These lines are designed to indicate moments of possible exhaustion of volatility in the market, suggesting that there may be a subsequent increase in volatility. When you activate "Show Faster Volatility," these lines are displayed on the chart.
"Show Average VWAPs Imbalance" displays weighted averages of different Volume Weighted Average Prices (VWAPs) in relation to specific market conditions. Here's an explanation of each component:
Standard VWAP:
The blue line represents the standard VWAP, a volume-weighted average of asset prices over a specific period.
VWAP with Added Imbalance (avg_vwap2):
The pink line is a weighted average that adds an imbalance value to the standard VWAP. This component highlights periods of market imbalance.
VWAP with Balance (avg_vwap3):
The lilac line is a weighted average that adds balance based on the imbalance between uptrend and downtrend, reflecting changes in volume. This provides insights into supply and demand dynamics.
Overall Average of VWAPs (avg_vwaptl):
The violet line is a weighted average that incorporates both standard and adjusted VWAPs, offering an overview of market behavior under different considered conditions.
Visual Customization (Show Average VWAPs Imbalance):
Users have the option to show or hide these average lines on the chart, allowing for a clear visualization of market trends.
"Show Min Variation VWAP" is associated with the calculation and display of a smoothed version of the Volume Weighted Average Price (VWAP), taking into account the minimum price variation over a specific period.
"How Imbalance Anchor VWAP Calculated as the smoothed relationship between liquidity difference and maximum VWAP equilibrium" is associated with the calculation and display of a smoothed version of the Imbalance Anchor VWAP. Here is a detailed explanation:
Calculations and Smoothing:
The variable "smoothed_difference" represents the exponential moving average (EMA) of the difference between two variables related to liquidity.
"smoothed_difference2" is the division of "smoothed_difference" by the maximum variation of the VWAP Equilibrium.
"smoothed_difference3" involves additional manipulation of "smoothed_difference" and "vwap_delta3."
"smoothed_difference4" incorporates the previous results, adjusted by the value of the VWAP.
Visual Customization:
The user has the option to enable or disable the display on the chart.
The line is colored in a shade of green.
It provides a smoothed representation of the Imbalance Anchor VWAP.
The line is colored in a shade of blue, and the calculation involves the summation of moving averages (20, 50, 200). Afterward, there is division by 3. Additionally, there is the summation of moving averages (766, 866, 966), divided by 3. The final step is to add these results together and divide by 2. media name is Imbalance Value2
Show VWAP Equilibrium (Max Variation) Calculated as the difference between two VWAPs derived from the highest and lowest price changes
Show Equilibrium VWAP Calculated as the sum of VWAP and (sma200 - sma20)
calculate the difference between the media of 200 to 20
Show Equilibrium VWAP Calculated as the sum of VWAP and (766+866+966)/3 - (sma200 - sma20)
Show Equilibrium VWAP Standard Deviation Calculated as the Exponential Moving Average (EMA) of the Standard Deviation of SMA (sma200 + sma20 + sma8)/3
Show Equilibrium VWAP Delta Calculated as the ratio of the smoothed VWAP Delta Result componentes
Show Standard Deviation Equilibrium VWAP Delta: Calculated as the Standard Deviation between the Average of VWAP Delta Result Components and Their Smoothed Versions
This average attempts to calculate the equilibrium."
vwap_equilibrium:
Definition: Represents the Volume Weighted Average Price (VWAP) adjusted by the volume-weighted average of the price (hl2) multiplied by volume, focusing on periods of volume equilibrium.
Calculation: Utilizes the simple moving average weighted (sma) of the product of the volume-weighted average price and volume only when there is no volume imbalance.
Interpretation: This indicator provides a view of the volume-weighted price trend during moments when the market is in equilibrium, meaning there is no noticeable imbalance in volume conditions. The calculation of VWAP is adjusted to reflect market characteristics during periods of stability.
vwap_percent_condition:
Definition: Represents the Volume Weighted Average Price (VWAP) adjusted by the volume-weighted average of the price multiplied by volume, with a focus on conditions where the percentage volume variation surpasses a predefined threshold.
Calculation: Utilizes the simple moving average weighted of the product of the volume-weighted average price and volume only when the percentage volume variation exceeds a specific threshold.
Interpretation: Provides insight into the volume-weighted price trend during conditions where the percentage volume variation exceeds a predefined limit.
The objective of these two VWAPs is to calculate possible equilibrium points between buyers and sellers.
The indicator works for all timeframes This indicator can be adjusted according to the preferences and characteristics of the specific asset or market. It provides clear visual information and can be used as a complementary tool for technical analysis in trading strategies.
Interesting
Interesting
lookback period 7 , 12, 20,70,200, 500,766,866,966
imbalance threshold 2.4, 3.3 ,4.2
The objective of this indicator is to identify and highlight various points of imbalance and equilibrium.
Moving Average Continuity [QuantVue]"Moving Average Continuity," is designed to compare the position of two Moving Averages (MAs) across multiple timeframes.
The user can select three timeframes and determine the length and type of both a fast and slow moving average.
The indicator will display a small table in a user selected location.
This table helps traders quickly determine if, for their selected timeframes, the faster moving average is trending above or below the slower moving average.
The “Moving Average Continuity” indicator can also send you three types of alerts;
1. All moving averages are aligned bullish
2. All moving averages are aligned bearish
3. Moving averages are mixed
Key Features:
1. Timeframes: The user can select up to three distinct timeframes to compare the moving averages.
2. Moving Average Inputs: For each MA, users can determine:
• Length of the MA
• Type of the MA - Options include EMA (Exponential Moving Average), SMA (Simple Moving Average), HMA (Hull Moving Average), WMA (Weighted Moving Average), and VWMA (Volume Weighted Moving Average).
3. Positioning: Users have the ability to adjust the table's positioning (top, middle, or bottom) and horizontal alignment (right, center, or left) on the chart overlay.
4. Runtime Error Prevention: The indicator will throw an error if the chart's timeframe exceeds the maximum selected timeframe, ensuring that comparisons are done correctly.
Give this indicator a BOOST and COMMENT your thoughts!
We hope you enjoy.
Cheers.

TASC 2023.05 Cong Adaptive Moving Average█ OVERVIEW
TASC's May 2023 edition of Traders' Tips features an article titled "An Adaptive Moving Average For Swing Trading" by Scott Cong. The article presents a new adaptive moving average (AMA) that adjusts its parameters automatically based on market volatility. The AMA tracks price closely during trending movements and remains flat during congestion areas.
█ CONCEPTS
Conventional moving averages (MAs) use a fixed lookback period, which may lead to limited performance in constantly changing market conditions. Perry Kaufman's adaptive moving average , first described in his 1995 book Smarter Trading, is a great example of how an AMA can self-adjust to adapt to changing environments. Scott Cong draws inspiration from Kaufman's approach and proposes a new way to calculate the AMA smoothing factor.
█ CALCULATIONS
Following Perry Kaufman's approach, Scott Cong's AMA is calculated progressively as:
AMA = α * Close + (1 − α) * AMA(1),
where:
Close = Close of the current bar
AMA(1) = AMA value of the previous bar
α = Smoothing factor between 0 and 1, defined by the lookback period
The smoothing factor determines the performance of AMA. In Cong's approach, it is calculated as:
α = Result / Effort,
where:
Result = Highest price of the n period − Lowest price of the n period
Effort = Sum(TR, n ), where TR stands for Wilder’s true range values of individual bars of the n period
n = Lookback period
As the price range is always no greater than the total journey, α is ensured to be between 0 and 1.
VWMA/SMA 3Commas BotThis strategy utilizes two pairs of different Moving Averages, two Volume-Weighted Moving Averages (VWMA) and two Simple Moving Averages (SMA).
There is a FAST and SLOW version of each VWMA and SMA.
The concept behind this strategy is that volume is not taken into account when calculating a Simple Moving Average.
Simple Moving Averages are often used to determine the dominant direction of price movement and to help a trader look past any short-term volatility or 'noise' from price movement, and instead determine the OVERALL direction of price movement so that one can trade in that direction (trend-following) or look for opportunities to trade AGAINST that direction (fading).
By comparing the different movements of a Volume-Weighted Moving Average against a Simple Moving Average of the same length, a trader can get a better picture of what price movements are actually significant, helping to reduce false signals that might occur from only using Simple Moving Averages.
The practical applications of this strategy are identifying dominant directional trends. These can be found when the Volume Weighted Moving Average is moving in the same direction as the Simple Moving Average, and ideally, tracking above it.
This would indicate that there is sufficient volume supporting an uptrend or downtrend, and thus gives traders additional confirmation to potentially look for a trade in that direction.
One can initially look for the Fast VWMA to track above the Fast SMA as your initial sign of bullish confirmation (reversed for downtrending markets). Then, when the Fast VWMA crosses over the Slow SMA, one can determine additional trend strength. Finally, when the Slow VWMA crosses over the Slow SMA, one can determine that the trend is truly strong.
Traders can choose to look for trade entries at either of those triggers, depending on risk tolerance and risk appetite.
Furthermore, this strategy can be used to identify divergence or weakness in trending movements. This is very helpful for identifying potential areas to exit one's trade or even look for counter-trend trades (reversals).
These moments occur when the Volume-Weighted Moving Average, either fast or slow, begins to trade in the opposite direction as their Simple Moving Average counterpart.
For instance, if price has been trending upwards for awhile, and the Fast VWMA begins to trade underneath the Fast SMA, this is an indication that volume is beginning to falter. Uptrends need appropriate volume to continue moving with momentum, so when we see volume begin to falter, it can be a potential sign of an upcoming reversal in trend.
Depending on how quickly one wants to enter into a movement, one could look for crosses of the Fast VWMA under/over the Fast SMA, crosses of the Fast VWMA over/under the Slow SMA, or crosses over/under of the Slow VWMA and the Slow SMA.
This concept was originally published here on TradingView by ProfitProgrammers.
Here is a link to his original indicator script:
I have added onto this concept by:
converting the original indicator into a strategy tester for backtesting
adding the ability to conveniently test long or short strategies, or both
adding the ability to calculate dynamic position sizes
adding the ability to calculate dynamic stop losses and take profit levels using the Average True Range
adding the ability to exit trades based on overbought/oversold crosses of the Stochastic RSI
conveniently switch between different thresholds or speeds of the Moving Average crosses to test different strategies on different asset classes
easily hook this strategy up to 3Commas for automation via their DCA bot feature
Full credit to ProfitProgrammers for the original concept and idea.
Any feedback or suggestions are greatly appreciated.

Qullamaggie Breakout V2After publishing the Qullamaggie Breakout script and seeing that it had some decent results, I wanted to explore it a bit further. There were a few things I didn't like about that methodology that didn't really jive with the way I like to trade. So what I did was combined the Breakout Trend Follower strategy I had been using for entries with the Qullamaggie strategy for trailing stops once in profit. The results seem pretty good to me and an approach that fits my personality and something I can actually trade. Typically better profit than the Breakout Trend Follower by giving more room for your winners to run, while still protecting your entries by moving up the trailing stop until you are in profit, all while taking less trades, so that's great.
Everything is done with stop orders. So you set your buy stop at the recent swing high point and wait for a breakout. Once in a position you set your sell stop at the recent swing low point. The most recent swing high and low are shown on the chart for easy reference with the blue and orange horizontal lines. Once in a trade, trail your sell stop after a new swing low is registered (shown by the thicker orange stop line). Once you are in profit, leave that hard stop level there (the orange line will stay there helping you). Now, you wait for price to cross a Moving Average of your choosing (default is Daily 10 MA). Once the bar crosses that moving average, you move your stop to the low of that candle (shown by the blue stop line) and trail your stop along every crossing of the moving average until the trend changes and takes out your stop. So managing this trade is pretty easy...just wait for the stop lines to move and move your stop with them. It's a great way to trade when you can't be at your computer all the time because the stop orders take care of execution on both buy and sell side. If you use a daily timeframe for your moving averages (the default), you really only need to move stops around about once a day, so is a good part time trader's strategy in my opinion.
The best opportunities will come by scanning for stocks in the longer term timeframe of your moving averages. Wait for a consolidation on that timeframe so the anticipated breakout has some room to run. Once you've identified a good candidate, zoom in to your lower timeframe where the swing highs/lows will act as your entry and exit points, all while keeping the moving averages consistent between timeframes.
Hope you guys find it useful.
A few options available:
- Choose any timeframe for your moving averages, while using swing high/low points on intraday charts.
- Choose one of two moving averages shown for your trailing stops (default 10 and 20 MA).
- Choose to use the third moving average as a filter for keeping you out of trades that are below it (trading with the trend).
- Use the charts resolution candle or the moving average resolution candle for the moving average trailing stop.
- Only take trades where your buy level minus stop level is below a % of the Average Daily Range (ADR). This allows you to potentially have better risk/reward. I added a little table that shows the ADR of the stock/ticker as well as the range between the recent buy and sell levels (shown by the orange and blue horizontal lines) for easy reference.

Momentum Strategy (BTC/USDT; 1h) - MACD (with source code)Good morning traders.
It's been a while from my last publication of a strategy and today I want to share with you this small piece of script that showed quite interesting result across bitcoin and other altcoins.
The macd indicator is an indicator built on the difference between a fast moving average and a slow moving average: this difference is generally plottted with a blue line while the orange line is simply a moving average computed on this difference.
Usually this indicator is used in technical analysis for getting signals of buy and sell respectively when the macd crosses above or under its moving average: it means that the distance of the fast moving average (the most responsive one) from the slower one is getting lower than what it-used-to-be in the period considered: this could anticipate a cross of the two moving averages and you want to anticipate this potential trend reversal by opening a long position
Of course the workflow is specularly the same for opening short positions (or closing long positions)
What this strategy does is simply considering the moving average computed on macd and applying a linear regression on it: in this way, even though the signal can be sligthly delayed, you reduce noise plotting a smooth curve.
Then, it simply checks the maximums and the minimums of this curve detecting whenever the changes of the values start to be negative or positive, so it opens a short position (closes long) on the maximum on this curve and it opens a long position (closes short) on the minimum.
Of course, I set an option for using this strategy in a conventional way working on the crosses between macd and its moving average. Alternatively you can use this workflow if you prefer.
In conclusion, you can use a tons of moving averages: I made a function in pine in order to allw you to use any moving average you want for the two moving averages on which the macd is based or for the moving average computed on the macd
PLEASE, BE AWARE THAT THIS TRADING STRATEGY DOES NOT GUARANTEE ANY KIND OF SUCCESS IN ADVANCE. YOU ARE THE ONE AND ONLY RESPONSIBLE OF YOUR OWN DECISIONS, I DON'T TAKE ANY RESPONSIBILITY ASSOCIATED WITH THEM. IF YOU RUN THIS STRATEGY YOU ACCEPT THE POSSIBILITY OF LOOSING MONEY, ALL OF MY PUBBLICATIONS ARE SUPPOSED TO BE JUST FOR EDUCATIONAL PURPOSES.
IT IS AT YOUR OWN RISK WHETHER TO USE IT OR NOT
But if you make money out of this, please consider to buy me a beer 😜
Happy Trading!

TA█ TA Library
📊 OVERVIEW
TA is a Pine Script technical analysis library. This library provides 25+ moving averages and smoothing filters , from classic SMA/EMA to Kalman Filters and adaptive algorithms, implemented based on academic research.
🎯 Core Features
Academic Based - Algorithms follow original papers and formulas
Performance Optimized - Pre-calculated constants for faster response
Unified Interface - Consistent function design
Research Based - Integrates technical analysis research
🎯 CONCEPTS
Library Design Philosophy
This technical analysis library focuses on providing:
Academic Foundation
Algorithms based on published research papers and academic standards
Implementations that follow original mathematical formulations
Clear documentation with research references
Developer Experience
Unified interface design for consistent usage patterns
Pre-calculated constants for optimal performance
Comprehensive function collection to reduce development time
Single import statement for immediate access to all functions
Each indicator encapsulated as a simple function call - one line of code simplifies complexity
Technical Excellence
25+ carefully implemented moving averages and filters
Support for advanced algorithms like Kalman Filter and MAMA/FAMA
Optimized code structure for maintainability and reliability
Regular updates incorporating latest research developments
🚀 USING THIS LIBRARY
Import Library
//@version=6
import DCAUT/TA/1 as dta
indicator("Advanced Technical Analysis", overlay=true)
Basic Usage Example
// Classic moving average combination
ema20 = ta.ema(close, 20)
kama20 = dta.kama(close, 20)
plot(ema20, "EMA20", color.red, 2)
plot(kama20, "KAMA20", color.green, 2)
Advanced Trading System
// Adaptive moving average system
kama = dta.kama(close, 20, 2, 30)
= dta.mamaFama(close, 0.5, 0.05)
// Trend confirmation and entry signals
bullTrend = kama > kama and mamaValue > famaValue
bearTrend = kama < kama and mamaValue < famaValue
longSignal = ta.crossover(close, kama) and bullTrend
shortSignal = ta.crossunder(close, kama) and bearTrend
plot(kama, "KAMA", color.blue, 3)
plot(mamaValue, "MAMA", color.orange, 2)
plot(famaValue, "FAMA", color.purple, 2)
plotshape(longSignal, "Buy", shape.triangleup, location.belowbar, color.green)
plotshape(shortSignal, "Sell", shape.triangledown, location.abovebar, color.red)
📋 FUNCTIONS REFERENCE
ewma(source, alpha)
Calculates the Exponentially Weighted Moving Average with dynamic alpha parameter.
Parameters:
source (series float) : Series of values to process.
alpha (series float) : The smoothing parameter of the filter.
Returns: (float) The exponentially weighted moving average value.
dema(source, length)
Calculates the Double Exponential Moving Average (DEMA) of a given data series.
Parameters:
source (series float) : Series of values to process.
length (simple int) : Number of bars for the moving average calculation.
Returns: (float) The calculated Double Exponential Moving Average value.
tema(source, length)
Calculates the Triple Exponential Moving Average (TEMA) of a given data series.
Parameters:
source (series float) : Series of values to process.
length (simple int) : Number of bars for the moving average calculation.
Returns: (float) The calculated Triple Exponential Moving Average value.
zlema(source, length)
Calculates the Zero-Lag Exponential Moving Average (ZLEMA) of a given data series. This indicator attempts to eliminate the lag inherent in all moving averages.
Parameters:
source (series float) : Series of values to process.
length (simple int) : Number of bars for the moving average calculation.
Returns: (float) The calculated Zero-Lag Exponential Moving Average value.
tma(source, length)
Calculates the Triangular Moving Average (TMA) of a given data series. TMA is a double-smoothed simple moving average that reduces noise.
Parameters:
source (series float) : Series of values to process.
length (simple int) : Number of bars for the moving average calculation.
Returns: (float) The calculated Triangular Moving Average value.
frama(source, length)
Calculates the Fractal Adaptive Moving Average (FRAMA) of a given data series. FRAMA adapts its smoothing factor based on fractal geometry to reduce lag. Developed by John Ehlers.
Parameters:
source (series float) : Series of values to process.
length (simple int) : Number of bars for the moving average calculation.
Returns: (float) The calculated Fractal Adaptive Moving Average value.
kama(source, length, fastLength, slowLength)
Calculates Kaufman's Adaptive Moving Average (KAMA) of a given data series. KAMA adjusts its smoothing based on market efficiency ratio. Developed by Perry J. Kaufman.
Parameters:
source (series float) : Series of values to process.
length (simple int) : Number of bars for the efficiency calculation.
fastLength (simple int) : Fast EMA length for smoothing calculation. Optional. Default is 2.
slowLength (simple int) : Slow EMA length for smoothing calculation. Optional. Default is 30.
Returns: (float) The calculated Kaufman's Adaptive Moving Average value.
t3(source, length, volumeFactor)
Calculates the Tilson Moving Average (T3) of a given data series. T3 is a triple-smoothed exponential moving average with improved lag characteristics. Developed by Tim Tillson.
Parameters:
source (series float) : Series of values to process.
length (simple int) : Number of bars for the moving average calculation.
volumeFactor (simple float) : Volume factor affecting responsiveness. Optional. Default is 0.7.
Returns: (float) The calculated Tilson Moving Average value.
ultimateSmoother(source, length)
Calculates the Ultimate Smoother of a given data series. Uses advanced filtering techniques to reduce noise while maintaining responsiveness. Based on digital signal processing principles by John Ehlers.
Parameters:
source (series float) : Series of values to process.
length (simple int) : Number of bars for the smoothing calculation.
Returns: (float) The calculated Ultimate Smoother value.
kalmanFilter(source, processNoise, measurementNoise)
Calculates the Kalman Filter of a given data series. Optimal estimation algorithm that estimates true value from noisy observations. Based on the Kalman Filter algorithm developed by Rudolf Kalman (1960).
Parameters:
source (series float) : Series of values to process.
processNoise (simple float) : Process noise variance (Q). Controls adaptation speed. Optional. Default is 0.05.
measurementNoise (simple float) : Measurement noise variance (R). Controls smoothing. Optional. Default is 1.0.
Returns: (float) The calculated Kalman Filter value.
mcginleyDynamic(source, length)
Calculates the McGinley Dynamic of a given data series. McGinley Dynamic is an adaptive moving average that adjusts to market speed changes. Developed by John R. McGinley Jr.
Parameters:
source (series float) : Series of values to process.
length (simple int) : Number of bars for the dynamic calculation.
Returns: (float) The calculated McGinley Dynamic value.
mama(source, fastLimit, slowLimit)
Calculates the Mesa Adaptive Moving Average (MAMA) of a given data series. MAMA uses Hilbert Transform Discriminator to adapt to market cycles dynamically. Developed by John F. Ehlers.
Parameters:
source (series float) : Series of values to process.
fastLimit (simple float) : Maximum alpha (responsiveness). Optional. Default is 0.5.
slowLimit (simple float) : Minimum alpha (smoothing). Optional. Default is 0.05.
Returns: (float) The calculated Mesa Adaptive Moving Average value.
fama(source, fastLimit, slowLimit)
Calculates the Following Adaptive Moving Average (FAMA) of a given data series. FAMA follows MAMA with reduced responsiveness for crossover signals. Developed by John F. Ehlers.
Parameters:
source (series float) : Series of values to process.
fastLimit (simple float) : Maximum alpha (responsiveness). Optional. Default is 0.5.
slowLimit (simple float) : Minimum alpha (smoothing). Optional. Default is 0.05.
Returns: (float) The calculated Following Adaptive Moving Average value.
mamaFama(source, fastLimit, slowLimit)
Calculates Mesa Adaptive Moving Average (MAMA) and Following Adaptive Moving Average (FAMA).
Parameters:
source (series float) : Series of values to process.
fastLimit (simple float) : Maximum alpha (responsiveness). Optional. Default is 0.5.
slowLimit (simple float) : Minimum alpha (smoothing). Optional. Default is 0.05.
Returns: ( ) Tuple containing values.
laguerreFilter(source, length, gamma, order)
Calculates the standard N-order Laguerre Filter of a given data series. Standard Laguerre Filter uses uniform weighting across all polynomial terms. Developed by John F. Ehlers.
Parameters:
source (series float) : Series of values to process.
length (simple int) : Length for UltimateSmoother preprocessing.
gamma (simple float) : Feedback coefficient (0-1). Lower values reduce lag. Optional. Default is 0.8.
order (simple int) : The order of the Laguerre filter (1-10). Higher order increases lag. Optional. Default is 8.
Returns: (float) The calculated standard Laguerre Filter value.
laguerreBinomialFilter(source, length, gamma)
Calculates the Laguerre Binomial Filter of a given data series. Uses 6-pole feedback with binomial weighting coefficients. Developed by John F. Ehlers.
Parameters:
source (series float) : Series of values to process.
length (simple int) : Length for UltimateSmoother preprocessing.
gamma (simple float) : Feedback coefficient (0-1). Lower values reduce lag. Optional. Default is 0.5.
Returns: (float) The calculated Laguerre Binomial Filter value.
superSmoother(source, length)
Calculates the Super Smoother of a given data series. SuperSmoother is a second-order Butterworth filter from aerospace technology. Developed by John F. Ehlers.
Parameters:
source (series float) : Series of values to process.
length (simple int) : Period for the filter calculation.
Returns: (float) The calculated Super Smoother value.
rangeFilter(source, length, multiplier)
Calculates the Range Filter of a given data series. Range Filter reduces noise by filtering price movements within a dynamic range.
Parameters:
source (series float) : Series of values to process.
length (simple int) : Number of bars for the average range calculation.
multiplier (simple float) : Multiplier for the smooth range. Higher values increase filtering. Optional. Default is 2.618.
Returns: ( ) Tuple containing filtered value, trend direction, upper band, and lower band.
qqe(source, rsiLength, rsiSmooth, qqeFactor)
Calculates the Quantitative Qualitative Estimation (QQE) of a given data series. QQE is an improved RSI that reduces noise and provides smoother signals. Developed by Igor Livshin.
Parameters:
source (series float) : Series of values to process.
rsiLength (simple int) : Number of bars for the RSI calculation. Optional. Default is 14.
rsiSmooth (simple int) : Number of bars for smoothing the RSI. Optional. Default is 5.
qqeFactor (simple float) : QQE factor for volatility band width. Optional. Default is 4.236.
Returns: ( ) Tuple containing smoothed RSI and QQE trend line.
sslChannel(source, length)
Calculates the Semaphore Signal Level (SSL) Channel of a given data series. SSL Channel provides clear trend signals using moving averages of high and low prices.
Parameters:
source (series float) : Series of values to process.
length (simple int) : Number of bars for the moving average calculation.
Returns: ( ) Tuple containing SSL Up and SSL Down lines.
ma(source, length, maType)
Calculates a Moving Average based on the specified type. Universal interface supporting all moving average algorithms.
Parameters:
source (series float) : Series of values to process.
length (simple int) : Number of bars for the moving average calculation.
maType (simple MaType) : Type of moving average to calculate. Optional. Default is SMA.
Returns: (float) The calculated moving average value based on the specified type.
atr(length, maType)
Calculates the Average True Range (ATR) using the specified moving average type. Developed by J. Welles Wilder Jr.
Parameters:
length (simple int) : Number of bars for the ATR calculation.
maType (simple MaType) : Type of moving average to use for smoothing. Optional. Default is RMA.
Returns: (float) The calculated Average True Range value.
macd(source, fastLength, slowLength, signalLength, maType, signalMaType)
Calculates the Moving Average Convergence Divergence (MACD) with customizable MA types. Developed by Gerald Appel.
Parameters:
source (series float) : Series of values to process.
fastLength (simple int) : Period for the fast moving average.
slowLength (simple int) : Period for the slow moving average.
signalLength (simple int) : Period for the signal line moving average.
maType (simple MaType) : Type of moving average for main MACD calculation. Optional. Default is EMA.
signalMaType (simple MaType) : Type of moving average for signal line calculation. Optional. Default is EMA.
Returns: ( ) Tuple containing MACD line, signal line, and histogram values.
dmao(source, fastLength, slowLength, maType)
Calculates the Dual Moving Average Oscillator (DMAO) of a given data series. Uses the same algorithm as the Percentage Price Oscillator (PPO), but can be applied to any data series.
Parameters:
source (series float) : Series of values to process.
fastLength (simple int) : Period for the fast moving average.
slowLength (simple int) : Period for the slow moving average.
maType (simple MaType) : Type of moving average to use for both calculations. Optional. Default is EMA.
Returns: (float) The calculated Dual Moving Average Oscillator value as a percentage.
continuationIndex(source, length, gamma, order)
Calculates the Continuation Index of a given data series. The index represents the Inverse Fisher Transform of the normalized difference between an UltimateSmoother and an N-order Laguerre filter. Developed by John F. Ehlers, published in TASC 2025.09.
Parameters:
source (series float) : Series of values to process.
length (simple int) : The calculation length.
gamma (simple float) : Controls the phase response of the Laguerre filter. Optional. Default is 0.8.
order (simple int) : The order of the Laguerre filter (1-10). Optional. Default is 8.
Returns: (float) The calculated Continuation Index value.
📚 RELEASE NOTES
v1.0 (2025.09.24)
✅ 25+ technical analysis functions
✅ Complete adaptive moving average series (KAMA, FRAMA, MAMA/FAMA)
✅ Advanced signal processing filters (Kalman, Laguerre, SuperSmoother, UltimateSmoother)
✅ Performance optimized with pre-calculated constants and efficient algorithms
✅ Unified function interface design following TradingView best practices
✅ Comprehensive moving average collection (DEMA, TEMA, ZLEMA, T3, etc.)
✅ Volatility and trend detection tools (QQE, SSL Channel, Range Filter)
✅ Continuation Index - Latest research from TASC 2025.09
✅ MACD and ATR calculations supporting multiple moving average types
✅ Dual Moving Average Oscillator (DMAO) for arbitrary data series analysis

EMA/SMA Ribbon Pro (AUTO HTF + Labels)This indicator is a multi-timeframe (MTF) moving average ribbon that dynamically adjusts to the next highest timeframe. It provides a visual representation of market trends by stacking multiple EMAs and SMAs with customizable color fills and labels.
Features
✅ Multi-Timeframe (MTF) Support: Automatically detects the next highest time frame or allows for manual selection
✅ Customizable Moving Averages: Supports EMA and SMA with different lengths for flexible configuration
✅ Ribbon Visualization: Smooth color transitions between different moving averages for better trend identification
✅ Crossover Labels: Detects bullish and bearish EMA/SMA crossovers and marks them on the chart
✅ Price Labels & Timeframe Display: Displays moving average values to the right of the price axis with customizable label padding and colors
How It Works
Select the HTF mode: Manual or automatic
Choose EMA/SMA lengths to create different ribbons
Enable/disable price labels for each moving average
Customize colors and transparency for ribbons and labels
Crossover labels appear when faster moving averages cross slower ones and vice versa
Use Cases
📌 Trend Identification: Identify bullish and bearish trends using multiple EMAs and SMAs
📌 Support & Resistance Zones: MAs can act as dynamic support and resistance levels
📌 Reversal & Confirmation Signals: Watch for MTF crossovers to confirm trend changes
Customization
🔹 Standard EMA Lengths: 6, 8, 13, 21, 34, 48, 100, 200, 300, 400
🔹 SMA Lengths: 48, 100, 200
🔹 Color Adjustments: Set custom colors for bullish/bearish ribbons
🔹 Crossovers: Enable/disable custom crossover pairs (e.g., 100/200 EMA, 200 EMA/SMA).
This indicator is perfect for traders who rely on multi-timeframe confluence while seeking to enhance their market analysis and decision-making process.
As always, by combining EMA/SMA Ribbon with other tools, traders ensure that they are not relying on a single indicator. This layered approach can reduce the likelihood of false signals and improve overall trading accuracy.
As always, be sure to use any indicator with price action and volume indicators for better trade confirmation!

Ultra Disparity IndexGain insights into price movements across multiple timeframes with the Ultra Disparity Index . This indicator highlights overbought/oversold levels based on price disparities from moving averages.
Introduction
The Ultra Disparity Index is designed for traders who seek a deeper understanding of price movements and trends across various timeframes. By analyzing the disparity between the current price and its moving averages, the indicator helps identify overbought and oversold conditions.
Detailed Description
The indicator works by calculating the percentage difference between the current price and its moving averages over four user-defined lengths. It operates on multiple timeframes monthly, weekly, daily, 4-hour, and 1-hour giving traders a comprehensive view of market dynamics.
.........
Disparity Calculation
The indicator computes how far the current price is from moving averages to reveal the degree of disparity.
.....
Overbought/Oversold Zones
By normalizing disparities into percentages relative to the overbought/oversold range, the indicator represents overbought (100%) and oversold (-100%).
.....
Timeframe Flexibility
The user can visualize data from monthly to hourly intervals, ensuring adaptability to different trading strategies.
.....
Customizable Inputs
Users can configure moving average lengths and toggle visibility for specific timeframes and levels.
.........
Summary
The indicator uses simple moving averages (SMAs) as a benchmark for calculating disparity. This disparity is then analyzed using statistical tools, such as standard deviation, to derive meaningful levels. Finally, the results are visualized in a table, providing traders with an easy-to-read summary of disparity values and their respective normalized percentages.
Support/Resistance
Custom Moving Average Indicator with MACD, RSI, and Support/Resistance
This indicator is designed to help traders make informed trading decisions by integrating several technical indicators, including moving averages, the Relative Strength Index (RSI), and the Moving Average Convergence Divergence (MACD).
Key Features:
Moving Averages:
This indicator uses simple moving averages (SMAs) for several periods (4, 18, 66, 89, 632, 1000, 1500, 2000, and 3000 bars). This helps to identify the overall trend of the price and potential support and resistance levels.
The color of each moving average line is dynamically changed based on the closing price's position relative to the average; it turns red if the price is above the average and green if the price is below.
Relative Strength Index (RSI):
The RSI is calculated for a 14-bar period, which is a measure of overbought or oversold conditions.
An RSI value above 70 indicates an overbought condition, while a value below 30 indicates an oversold condition.
MACD:
The MACD is calculated using a fast length of 12, a slow length of 26, and a signal length of 9. Crossovers between the MACD line and the signal line indicate momentum shifts.
A crossover of the MACD line above the signal line suggests a potential buy signal, while a crossover below indicates a potential sell signal.
Buy and Sell Signals:
Buy Signal: Triggered when the MACD line crosses above the signal line, the RSI is below 30, the MACD is above 0, and there is high volume.
Sell Signal: Triggered when the MACD line crosses below the signal line, the RSI is above 70, the MACD is below 0, and there is high volume.
Alerts:
The indicator includes alerts that are triggered when buy and sell signals occur, helping traders respond quickly to market opportunities.
How to Trade Using the Indicator (continued):
Trading on Buy Signals:
Look for buy signals when the MACD line crosses above the signal line. Ensure that the RSI is below 30, indicating there is a potential for price recovery from an oversold condition.
Confirm that the volume is above the average, which indicates strong market participation and adds validity to the trade.
Trading on Sell Signals:
Search for sell signals when the MACD line crosses below the signal line. Check that the RSI is above 70 to confirm an overbought condition, implying the price may decline.
As with buy signals, ensure that volume is high to validate the strength of the sell signal.
Risk Management:
Use stop-loss orders to protect your capital. Establish an initial loss threshold based on your risk management strategy.
Continuously monitor the market and new signals and adjust your approach according to your market analysis.
Conclusion:
This combined indicator helps traders make informed decisions by relying on a set of technical tools. To achieve the best results, ensure you integrate the analysis from these indicators with your trading strategies and other techniques.
Feel free to use this explanation as an introduction or guide to inform traders on how to effectively use the indicator. If you have any more questions or need further details, don't hesitate to ask!

[blackcat] L1 BS Line of Defense █ OVERVIEW
The Pine Script provided is an advanced technical indicator designed to generate reliable buy and sell signals by integrating momentum, moving averages, and price level analyses. It employs a custom weighted moving average (WMA) and exponential moving averages (EMAs) to compute key signals known as the "Buy/Sell Signal" and the "Short Line." These signals aim to pinpoint optimal entry and exit points for trades by evaluating their relationship with current market dynamics.
█ FEATURES
Key Components:
• Custom Weighted Moving Average ( WMA ): Provides enhanced flexibility compared to traditional moving averages.
• Exponential Moving Averages ( EMA ): Smooths the defense line and its short-term counterpart to filter out market noise.
• Momentum Indicators: Includes both short-term and long-term momentum adjusted via custom WMA and EMAs.
• Conditional Signal Generation: Signals are triggered based on precise crossovers and price conditions.
Logical Framework:
1 — Input Parameters:
No explicit user-defined inputs; defaults are used for internal calculations.
2 — Custom Functions:
• custom_wma : Calculates a custom WMA.
• calculate_buy_sell_signals : Generates buy and sell signals.
3 — Calculations:
• Momentum and Range Analysis over 9, 34, and 60-bar periods.
• Application of custom WMA and EMAs to smooth and refine data.
• Derivation of the "defense line" and "short_ema_defense."
4 — Plotting:
• Main signal lines ("Buy/Sell Signal" and "Short Line") are visualized.
• A horizontal zero line serves as a reference point.
█ HOW TO USE
To utilize this script effectively:
1 — Add the script to your TradingView chart.
2 — Observe the "Buy/Sell Signal" and "Short Line" relative to the zero line and each other.
3 — Look for crossovers and divergence patterns to identify potential trade opportunities.
4 — Combine the signals with additional technical indicators or fundamental analysis for better accuracy.
█ LIMITATIONS
While the script provides valuable insights, users should consider the following limitations:
• Default settings may not suit all markets or instruments; customization might be necessary.
• False signals can occur during volatile or ranging markets.
• Backtesting and optimization are recommended before live trading.
█ NOTES
For further enhancement and personalization:
• Introduce adjustable input parameters for WMA and EMA lengths and weights.
• Extend the script into a full-fledged trading strategy with entry and exit rules.
• Apply the script across multiple timeframes for comprehensive analysis.
• Incorporate risk management practices such as stop-loss and take-profit levels.
• Explore related Pine Script functions like security() for multi-timeframe analysis and [pine>alertcondition() for automated alerts.
Understanding core concepts like momentum, moving averages, and crossovers will aid in developing similar indicators or refining existing ones.
Heat Map Trend (VIDYA MA) [BigBeluga]The Heat Map Trend (VIDYA MA) - BigBeluga indicator is a multi-timeframe trend detection tool based on the Volumetric Variable Index Dynamic Average (VIDYA). This indicator calculates trends using volume momentum, or volatility if volume data is unavailable, and displays the trends across five customizable timeframes. It features a heat map to visualize trends, color-coded candles based on an average of the five timeframes, and a dashboard that shows the current trend direction for each timeframe. This tool helps traders identify trends while minimizing market noise and is particularly useful in detecting faster market changes in shorter timeframes.
🔵 KEY FEATURES & USAGE
◉ Volumetric Variable Index Dynamic Average (VIDYA):
The core of the indicator is the VIDYA moving average, which adjusts dynamically based on volume momentum. If volume data isn't available, the indicator uses volatility instead to smooth the moving average. This allows traders to assess the trend direction with more accuracy, using either volume or volatility, if volume data is not provided, as the basis for the trend calculation.
// VIDYA CALCULATION -----------------------------------------------------------------------------------------
// ATR (Average True Range) and volume calculation
bool volume_check = ta.cum(volume) <= 0
float atrVal = ta.atr(1)
float volVal = volume_check ? atrVal : volume // Use ATR if volume is not available
// @function: Calculate the VIDYA (Volumetric Variable Index Dynamic Average)
vidya(src, len, cmoLen) =>
float cmoVal = ta.sma(ta.cmo(volVal, cmoLen), 10) // Calculate the CMO and smooth it with an SMA
float absCmo = math.abs(cmoVal) // Absolute value of CMO
float alpha = 2 / (len + 1) // Alpha factor for smoothing
var float vidyaVal = 0.0 // Initialize VIDYA
vidyaVal := alpha * absCmo / 100 * src + (1 - alpha * absCmo / 100) * nz(vidyaVal ) // VIDYA formula
◉ Multi-Timeframe Trend Analysis with Heat Map Visualization:
The indicator calculates VIDYA across five customizable timeframes, allowing traders to analyze trends from multiple perspectives. The resulting trends are displayed as a heat map below the chart, where each timeframe is represented by a gradient color. The color intensity reflects the distance of the moving average (VIDYA) from the price, helping traders to identify trends on different timeframes visually. Shorter timeframes in the heat map are particularly useful for detecting faster market changes, while longer timeframes help to smooth out market noise and highlight the general trend.
Trend Direction:
Heat Map Reading:
◉ Dashboard for Multi-Timeframe Trend Directions:
The built-in dashboard displays the trend direction for each of the five timeframes, showing whether the trend is up or down. This quick overview provides traders with valuable insights into the current market conditions across multiple timeframes, helping them to assess whether the market is aligned or if there are conflicting trends. This allows for more informed decisions, especially during volatile periods.
◉ Color-Coded Candles Based on Multi-Timeframe Averages:
Candles are dynamically colored based on the average of the VIDYA across all five timeframes. When the price is in an uptrend, the candles are colored blue, while in a downtrend, they are colored red. If the VIDYA averages suggest a possible trend shift, the candles are displayed in orange to highlight a potential change in momentum. This color coding simplifies the process of identifying the dominant trend and spotting potential reversals.
BTC:
SP500:
◉ UP and DOWN Signals for Trend Direction Changes:
The indicator provides clear UP and DOWN signals to mark trend direction changes. When the average VIDYA crosses above a certain threshold, an UP signal is plotted, indicating a shift to an uptrend. Conversely, when it crosses below, a DOWN signal is shown, highlighting a transition to a downtrend. These signals help traders to quickly identify shifts in market direction and respond accordingly.
🔵 CUSTOMIZATION
VIDYA Length and Momentum Settings:
Adjust the length of the VIDYA moving average and the period for calculating volume momentum. These settings allow you to fine-tune how sensitive the indicator is to market changes, helping to match it with your preferred trading style.
Timeframe Selection:
Select five different timeframes to analyze trends simultaneously. This gives you the flexibility to focus on short-term trends, long-term trends, or a combination of both depending on your trading strategy.
Candle and Heat Map Color Customization:
Change the colors of the candles and heat map to fit your personal preferences. This customization allows you to align the visuals of the indicator with your overall chart setup, making it easier to analyze market conditions.
🔵 CONCLUSION
The Heat Trend (VIDYA MA) - BigBeluga indicator provides a comprehensive, multi-timeframe view of market trends, using VIDYA moving averages that adapt to volume momentum or volatility. Its heat map visualization, combined with a dashboard of trend directions and color-coded candles, makes it an invaluable tool for traders looking to understand both short-term market fluctuations and longer-term trends. By showing the overall market direction across multiple timeframes, it helps traders avoid market noise and focus on the bigger picture while being alert to faster shifts in shorter timeframes.
Bull Bear Candles with Volume ProfileUser Guide for Bull Bear Candles Indicator with Keltner Channels
Author: NellyN
Introduction
This indicator helps identify potential bullish and bearish trends in the market by analyzing buying and selling volume over two configurable timeframes. It calculates the percentage of buying and selling volume and displays the current market condition based on two moving averages for 2 periods.
Key Features
• Volume Analysis : Calculates Buy and Sell Volume for two configurable timeframes (e.g., 5 min, 15 min, 15 min. and 1 hour, etc.) and displays them as percentages.
• Moving Averages : Uses one Moving Average (MA) for two different time periods to identify trends (uptrend when shorter-term MA is above longer-term MA). You can also choose other Moving Average types like SMA, EMA, WMA, RMA, VWMA, or HMA.
• Colored Candles : Candles are colored green for bullish conditions, red for bearish conditions, and gray for neutral conditions.
• Market Condition Labels : Displays labels in table-view indicating the current market condition based on Buy and Sell Volume (Very Bullish, Very Bearish, Bullish/Bearish Retracement, Chop).
• Alerts: Generates alerts for potential buy and sell signals based on indicator conditions (Note: Enable alerts in the indicator settings).
• Visual Signals: Provides visual signals through colored candles and market condition labels in addition to alerts.
Input Parameters
• Source: Close price (default) or Heikin Ashi
• Timeframe: Select the timeframe for price and volume data used in the indicator (e.g., Daily, Hourly).
• Colored Candles On: Enable (True) or disable (False) coloring candles based on market conditions.
• Enable Alerts: Enable (True) or disable (False) alerts for buy/sell signals.
• Length of MA: Sets the length for the MAs used in trend identification (minimum 1).
• Lookback Period Vol. 1 & 2: Define the timeframes used to calculate buying and selling volume and the MA calculation (e.g., 5 min, 15 min).
Understanding the Outputs
• Cloud Fill: The area between two MAs is filled with a color that reflects the trend (green for uptrend, red for downtrend).
• Table: Shows Buy Volume, Sell Volume, Buy Percentage, Sell Percentage, and the current Market Condition Labels. (If you decide to see them uncomment them from the code simply removing the // in front of the code)
• Colored Candles and Market Condition Labels: Look for green candles and bullish labels for potential buying opportunities, and vice versa for red candles and bearish labels.
Bullish green label appears when short-term MA is above long-term MA AND Buy Volume percentage is greater than 50%.
Red cross for exiting long entry appears when we have bearish volume OR bearish crossover of the MA for the 2 periods.
Bearish red label appears when short-term MA is below long-term MA AND Buy Volume percentage is less than 50%.
Green cross for exiting short entry appears when we have bullish volume OR bullish crossover of the MA for the 2 periods.
• Bullish/Bearish Retracement: The moving averages indicate a potential trend reversal, while the Buy Volume percentage suggests a continuation of the prior trend. The candle color may be green, red, or gray depending on the current price position relative to the moving averages.
• Chop (Gray Candle): The moving averages are flat and the Buy Volume percentage is not significantly above or below 50%.
• Buy/Sell Alerts: The indicator generates alerts based on specific conditions, but these should be used in conjunction with other trading strategies and careful risk management.
Important Notes
• This indicator is for informational purposes only and should not be considered financial advice. Back-test the indicator with historical data to understand its performance before using it for live trading.
• Combine this indicator with other technical analysis tools.
